Note
You can download this example as a Jupyter notebook or start it in interactive mode.
Flow Plot Example
Here, we are going to import a network and plot the electricity flow
[1]:
import pypsa, os
import cartopy.crs as ccrs
import matplotlib.pyplot as plt
import pandas as pd

import warnings
from shapely.errors import ShapelyDeprecationWarning

warnings.filterwarnings("ignore", category=ShapelyDeprecationWarning)
plt.rc("figure", figsize=(10, 8))
Import and optimize a network
[2]:
n = pypsa.examples.ac_dc_meshed(from_master=True)
n.lopf()
WARNING:pypsa.io:Importing network from PyPSA version v0.17.1 while current version is v0.21.0. Read the release notes at https://pypsa.readthedocs.io/en/latest/release_notes.html to prepare your network for import.
INFO:pypsa.io:Imported network ac-dc-meshed.nc has buses, carriers, generators, global_constraints, lines, links, loads
WARNING:pypsa.components:Solving optimisation problem with pyomo.In PyPSA version 0.21 the default will change to ``n.lopf(pyomo=False)``.Explicitly set ``n.lopf(pyomo=True)`` to retain current behaviour.
INFO:pypsa.opf:Performed preliminary steps
INFO:pypsa.opf:Building pyomo model using `kirchhoff` formulation
INFO:pypsa.opf:Solving model using glpk
INFO:pypsa.opf:Optimization successful
# ==========================================================
# = Solver Results                                         =
# ==========================================================
# ----------------------------------------------------------
#   Problem Information
# ----------------------------------------------------------
Problem:
- Name: unknown
  Lower bound: -3474256.04054994
  Upper bound: -3474256.04054994
  Number of objectives: 1
  Number of constraints: 452
  Number of variables: 188
  Number of nonzeros: 991
  Sense: minimize
# ----------------------------------------------------------
#   Solver Information
# ----------------------------------------------------------
Solver:
- Status: ok
  Termination condition: optimal
  Statistics:
    Branch and bound:
      Number of bounded subproblems: 0
      Number of created subproblems: 0
  Error rc: 0
  Time: 0.010254383087158203
# ----------------------------------------------------------
#   Solution Information
# ----------------------------------------------------------
Solution:
- number of solutions: 0
  number of solutions displayed: 0
[2]:
(<SolverStatus.ok: 'ok'>, <TerminationCondition.optimal: 'optimal'>)
Get mean generator power by bus and carrier:
[3]:
gen = n.generators.assign(g=n.generators_t.p.mean()).groupby(["bus", "carrier"]).g.sum()
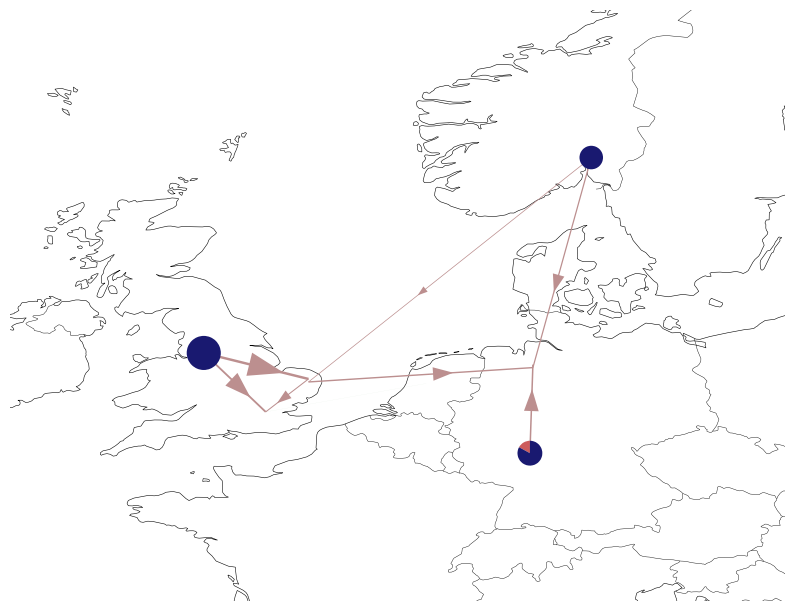
Plot the electricity flows:
[4]:
# links are not displayed for prettier output ('link_widths=0')
n.plot(
    bus_sizes=gen / 5e3,
    bus_colors={"gas": "indianred", "wind": "midnightblue"},
    margin=0.5,
    flow="mean",
    line_widths=0.1,
    link_widths=0,
)
plt.show()
/home/docs/checkouts/readthedocs.org/user_builds/pypsa/conda/v0.21.0/lib/python3.10/site-packages/pypsa/plot.py:259: FutureWarning: iteritems is deprecated and will be removed in a future version. Use .items instead.
  for i, ratio in ratios.iteritems():
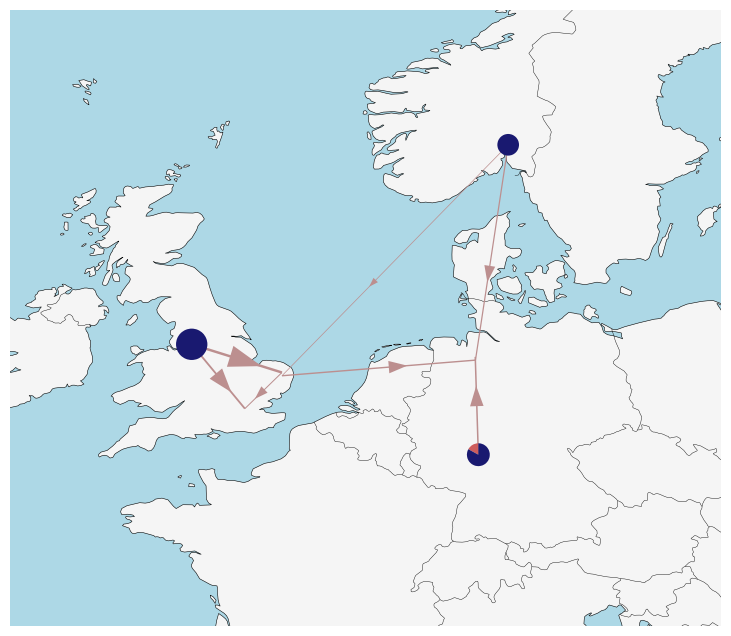
Plot the electricity flows with a different projection and a colored map:
[5]:
# links are not displayed for prettier output ('link_widths=0')
n.plot(
    bus_sizes=gen / 5e3,
    bus_colors={"gas": "indianred", "wind": "midnightblue"},
    margin=0.5,
    flow="mean",
    line_widths=0.1,
    link_widths=0,
    projection=ccrs.EqualEarth(),
    color_geomap=True,
)
plt.show()
/home/docs/checkouts/readthedocs.org/user_builds/pypsa/conda/v0.21.0/lib/python3.10/site-packages/pypsa/plot.py:259: FutureWarning: iteritems is deprecated and will be removed in a future version. Use .items instead.
  for i, ratio in ratios.iteritems():
Set arbitrary values as flow argument using the MultiIndex of n.branches():
[6]:
flow = pd.Series(10, index=n.branches().index)
[7]:
flow
[7]:
component  name
Link       Norwich Converter    10
           Norway Converter     10
           Bremen Converter     10
           DC link              10
Line       0                    10
           1                    10
           2                    10
           3                    10
           4                    10
           5                    10
           6                    10
dtype: int64
[8]:
# links are not displayed for prettier output ('link_widths=0')
n.plot(
    bus_sizes=gen / 5e3,
    bus_colors={"gas": "indianred", "wind": "midnightblue"},
    margin=0.5,
    flow=flow,
    line_widths=2.7,
    link_widths=0,
    projection=ccrs.EqualEarth(),
    color_geomap=True,
)
plt.show()
/home/docs/checkouts/readthedocs.org/user_builds/pypsa/conda/v0.21.0/lib/python3.10/site-packages/pypsa/plot.py:259: FutureWarning: iteritems is deprecated and will be removed in a future version. Use .items instead.
  for i, ratio in ratios.iteritems():

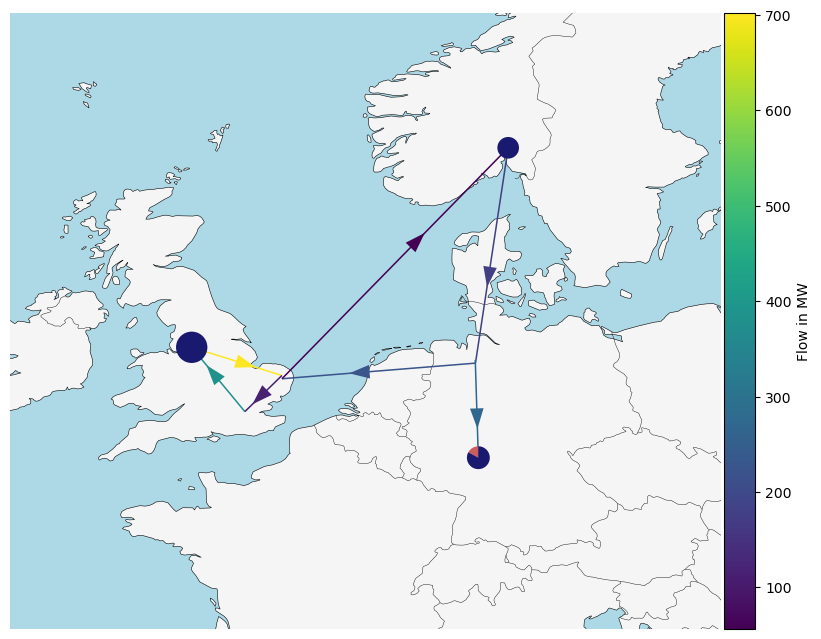
Adjust link colors according to their mean load:
[9]:
# Pandas series with MultiIndex
# links are not displayed for prettier output ('link_widths=0')
collection = n.plot(
    bus_sizes=gen / 5e3,
    bus_colors={"gas": "indianred", "wind": "midnightblue"},
    margin=0.5,
    flow=flow,
    line_widths=2.7,
    link_widths=0,
    projection=ccrs.EqualEarth(),
    color_geomap=True,
    line_colors=n.lines_t.p0.mean().abs(),
)

plt.colorbar(collection[2], fraction=0.04, pad=0.004, label="Flow in MW")
plt.show()
/home/docs/checkouts/readthedocs.org/user_builds/pypsa/conda/v0.21.0/lib/python3.10/site-packages/pypsa/plot.py:259: FutureWarning: iteritems is deprecated and will be removed in a future version. Use .items instead.
  for i, ratio in ratios.iteritems():