Note
You can download this example as a Jupyter notebook or start it in interactive mode.
Flow Plot Example
Here, we are going to import a network and plot the electricity flow
[1]:
import pypsa, os
import cartopy.crs as ccrs
import matplotlib.pyplot as plt
import pandas as pd

import warnings
from shapely.errors import ShapelyDeprecationWarning

warnings.filterwarnings("ignore", category=ShapelyDeprecationWarning)
plt.rc("figure", figsize=(10, 8))
Import and optimize a network
[2]:
n = pypsa.examples.ac_dc_meshed(from_master=True)
n.lopf()
WARNING:pypsa.io:Importing network from PyPSA version v0.17.1 while current version is v0.21.3. Read the release notes at https://pypsa.readthedocs.io/en/latest/release_notes.html to prepare your network for import.
INFO:pypsa.io:Imported network ac-dc-meshed.nc has buses, carriers, generators, global_constraints, lines, links, loads
INFO:pypsa.linopf:Prepare linear problem
INFO:pypsa.linopf:Total preparation time: 0.21s
INFO:pypsa.linopf:Solve linear problem using Glpk solver
INFO:pypsa.linopf:Optimization successful. Objective value: -3.47e+06
[2]:
('ok', 'optimal')
Get mean generator power by bus and carrier:
[3]:
gen = n.generators.assign(g=n.generators_t.p.mean()).groupby(["bus", "carrier"]).g.sum()
Plot the electricity flows:
[4]:
# links are not displayed for prettier output ('link_widths=0')
n.plot(
    bus_sizes=gen / 5e3,
    bus_colors={"gas": "indianred", "wind": "midnightblue"},
    margin=0.5,
    flow="mean",
    line_widths=0.1,
    link_widths=0,
)
plt.show()
/home/docs/checkouts/readthedocs.org/user_builds/pypsa/conda/v0.21.3/lib/python3.11/site-packages/pypsa/plot.py:259: FutureWarning: iteritems is deprecated and will be removed in a future version. Use .items instead.
  for i, ratio in ratios.iteritems():
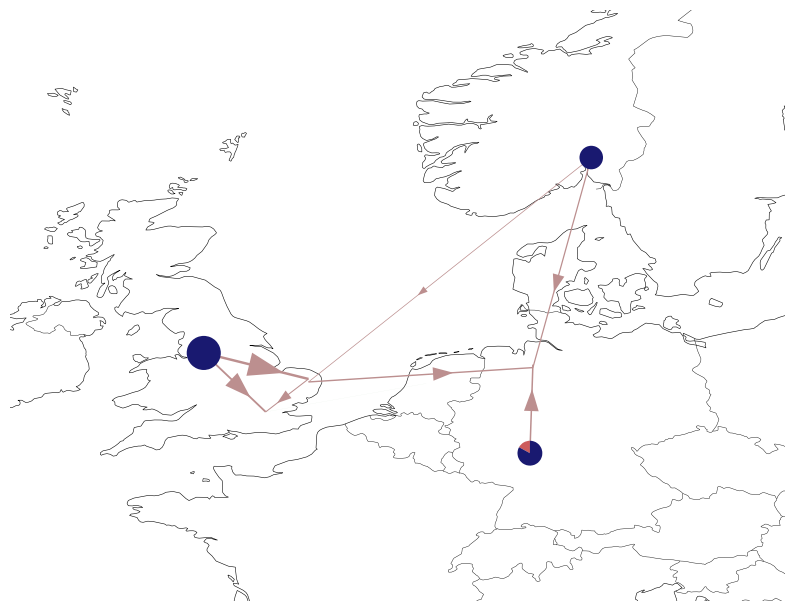
Plot the electricity flows with a different projection and a colored map:
[5]:
# links are not displayed for prettier output ('link_widths=0')
n.plot(
    bus_sizes=gen / 5e3,
    bus_colors={"gas": "indianred", "wind": "midnightblue"},
    margin=0.5,
    flow="mean",
    line_widths=0.1,
    link_widths=0,
    projection=ccrs.EqualEarth(),
    color_geomap=True,
)
plt.show()
/home/docs/checkouts/readthedocs.org/user_builds/pypsa/conda/v0.21.3/lib/python3.11/site-packages/pypsa/plot.py:259: FutureWarning: iteritems is deprecated and will be removed in a future version. Use .items instead.
  for i, ratio in ratios.iteritems():
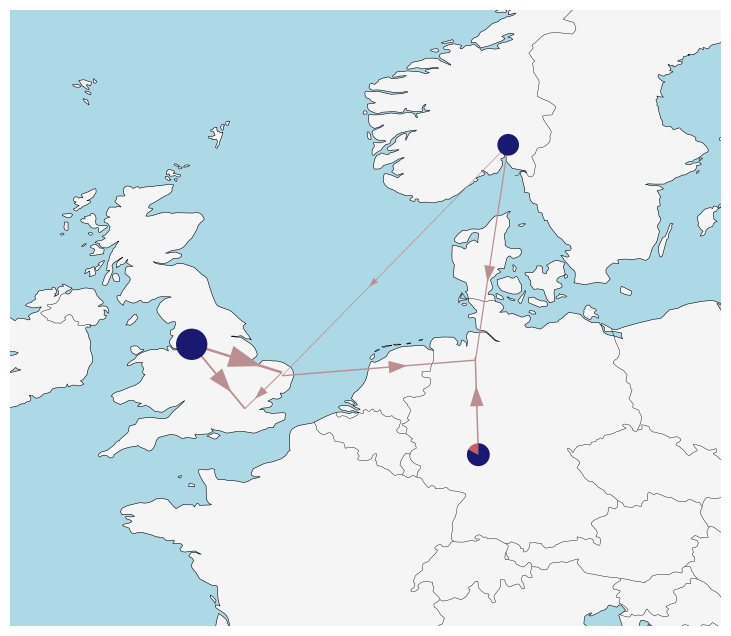
Set arbitrary values as flow argument using the MultiIndex of n.branches():
[6]:
flow = pd.Series(10, index=n.branches().index)
[7]:
flow
[7]:
component  name
Link       Norwich Converter    10
           Norway Converter     10
           Bremen Converter     10
           DC link              10
Line       0                    10
           1                    10
           2                    10
           3                    10
           4                    10
           5                    10
           6                    10
dtype: int64
[8]:
# links are not displayed for prettier output ('link_widths=0')
n.plot(
    bus_sizes=gen / 5e3,
    bus_colors={"gas": "indianred", "wind": "midnightblue"},
    margin=0.5,
    flow=flow,
    line_widths=2.7,
    link_widths=0,
    projection=ccrs.EqualEarth(),
    color_geomap=True,
)
plt.show()
/home/docs/checkouts/readthedocs.org/user_builds/pypsa/conda/v0.21.3/lib/python3.11/site-packages/pypsa/plot.py:259: FutureWarning: iteritems is deprecated and will be removed in a future version. Use .items instead.
  for i, ratio in ratios.iteritems():

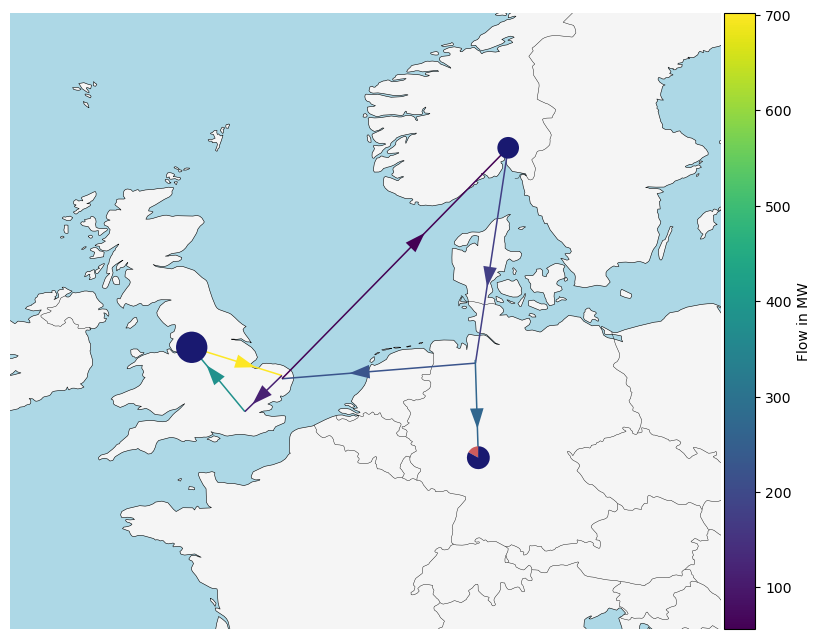
Adjust link colors according to their mean load:
[9]:
# Pandas series with MultiIndex
# links are not displayed for prettier output ('link_widths=0')
collection = n.plot(
    bus_sizes=gen / 5e3,
    bus_colors={"gas": "indianred", "wind": "midnightblue"},
    margin=0.5,
    flow=flow,
    line_widths=2.7,
    link_widths=0,
    projection=ccrs.EqualEarth(),
    color_geomap=True,
    line_colors=n.lines_t.p0.mean().abs(),
)

plt.colorbar(collection[2], fraction=0.04, pad=0.004, label="Flow in MW")
plt.show()
/home/docs/checkouts/readthedocs.org/user_builds/pypsa/conda/v0.21.3/lib/python3.11/site-packages/pypsa/plot.py:259: FutureWarning: iteritems is deprecated and will be removed in a future version. Use .items instead.
  for i, ratio in ratios.iteritems():